I did get the opportunity to play with data from the PacketLogic machines that was deployed at DreamHack summer 2011. Basically we parsed a log containing a subset of all connections, extracted the outside IP (independent from if it was source or destination) and ran that through MaxMinds GeoIP API to get lon/lat. The data was mangled a bit and then fed to a website with an WebGL globe that showed the amount of connections as bars on the globe. You can see the globe “in action” in this presentation made by Karl ‘IcE^’ Anderssson, the teamleader for the Network-team at Dreamhack.
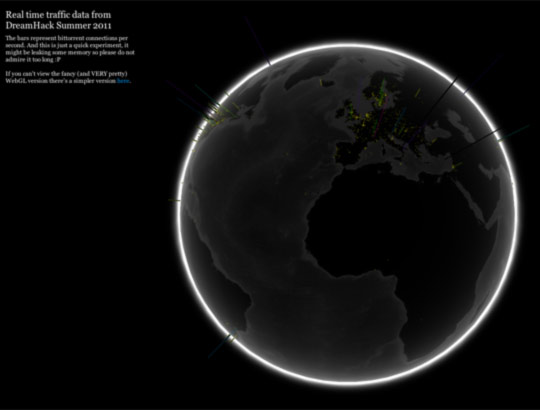
The globe was shown to Telia who provided the bandwidth for the event and they were interested in a more advanced version for the next event. I knew that there would be PacketLogics at the next event also so i didn’t have to change much code in the backend and concentrated on figure out what would be interesting for Telia and the participants at the event and also would look cool. Since this was done on my spare time it took a couple of weeks in Photoshop before i had something that I was satisfied, then the next step, creating all the shiny meters in HTML5.
Quite a few hours of adventures in the world of JavaScript i hade a working frontend and realized that i needed a couple more scripts in the back to feed it with data. Not having my own PacketLogic to code against was a bit of a problem but the documentation is quite good and I got example snippets from a friend that works at Procera. Those scripts worked fine with some small tweaks at the start of DHW11. The kind Virus84 was kind enough to lend me three blades in the blade server he had at DreamHack. The servers had enough power to handle both the geolocation decoding of about 80k IP/sec and the massive flood of visitors, after the three day event there had been more than 120,000 visitors. One problem was disk space, I had underestimated the amount of connections and overestimated how much disk there would be, but a quick update and small bash script made sure that no old cached data remained.
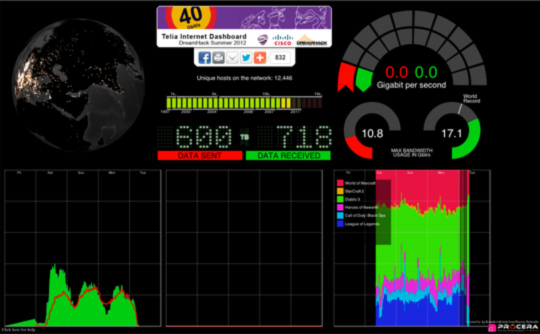
The dashboard contains six different panels. In the first row we have: a WebGL globe with a heat map counting connections, a VU-meter counting unique hosts on the network and a display of the total amunt of data passing out and in from the network, and to the right a speedometer displaying in- and out-speed in real time. At the left in the bottom row there’s a graph showing traffic over time for the whole event, the middle panel show the same for the last 5 minutes and was updated in real time, and to the right there was a graph showing the percentage of top 8 games played.
For DreamHack Summer 2012 some small changes of the graphic was done in the frontend but the big changes was in the backend. Since i didn’t know what kind of hardware the dashboard could run on I spent some time optimizing the slowest parts which was the geolocation and image rendering. For the first attempt the geo-data was stored in a MySQL database and every 15 minutes the amount of connections during that period was summed up and extracted for the heatmap-like globe. Unfortunately the database didn’t really handle the data gracefully and the SELECT took longer and longer the more data that was put in, so every other hour all rows was deleted and the DB optimized.
For DHS12 I decided to use flat files instead, the script that did the geolocation work was optimized and changed to hold the data in memory until it dumped it out into a text file every 15 minutes. The text file was then used by the script generating the heat map. The changes and optimizations had quite a large impact on performance, during DHS12 I had a couple of dualcore Opteron machines and one of these machines managed to quadruple the performance of the quad Xeons I used last event.
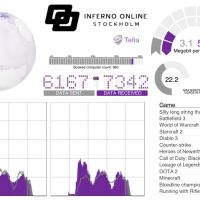
Telia, who also sponsor a internet café in Stockholm wanted a “Telia branded” version of the dashboard to run at the café so me and IcE started work on it. Since the café don’t have any of the cool Procera equipment that’s available at DreamHack IcE started working on a completely new backend and i worked on teliafying the frontend.
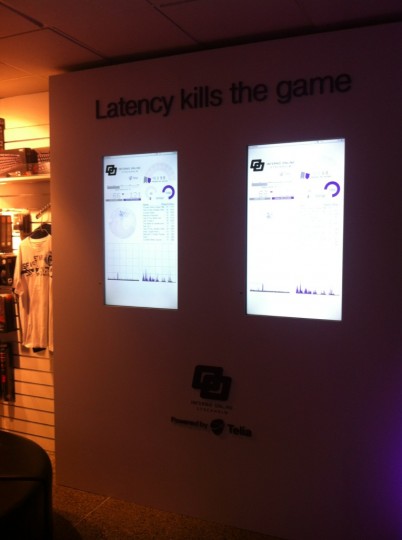
Telia wanted to deploy the dashboard in two vertical TVs mounted at the café, so at the last minute I had to rotate everything to fit the screens.
What changes we will see for DHW12 is a secret so far, but there will be some changes anyway so keep an eye on http://dashboard.dreamhack.se/.