I came across this bloggpost by Lars Wilderäng that among all the affiliate links (the UPS was nice tho) had a graph of energy price from Nordpool in Home Assistant. He even had the implementation details just to copy and paste. But I was a bit confounded, it looked a bit too complicated, so I made a slimmer version.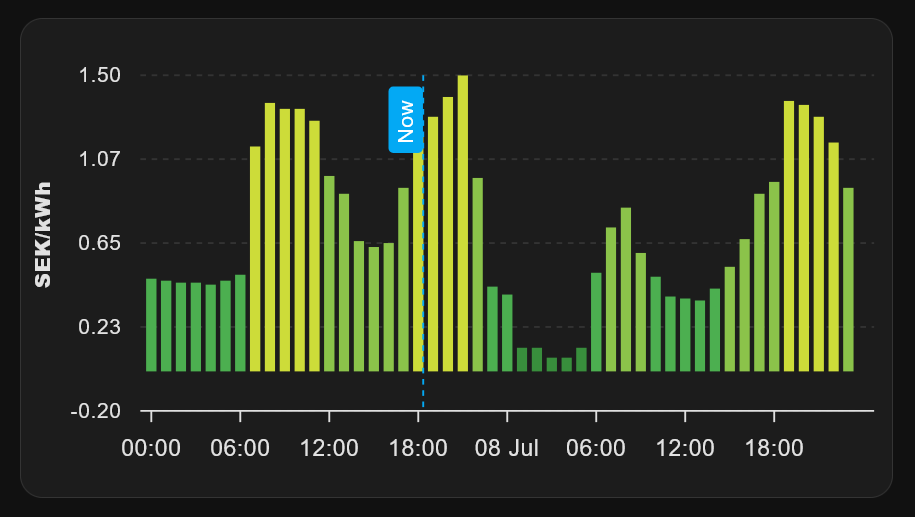
The version on Lars blog used a template sensor to concatenate the values for today and tomorrow (when available), which is not necessary since you do data manipulation in the card configuration already.
When you have created the Nordpool device/sensor in integrations you (after installing Apexcharts card) you simply create a new card on a dashboard and paste the following YAML:
type: custom:apexcharts-card
experimental:
  color_threshold: true
graph_span: 48h
header:
  title: Electricity Prices Today SE3
  show: false
span:
  start: day
now:
  show: true
  label: Now
series:
  - entity: sensor.nordpool_kwh_se3_sek_2_10_025
    type: column
    show:
      extremas: true
    float_precision: 3
    data_generator: >
      return entity.attributes.raw_today.map((data) => {
        return [data["start"], data["value"]];
      }).concat(entity.attributes.tomorrow_valid ?
      entity.attributes.raw_tomorrow.map((data) => {
        return [data["start"], data["value"]];
      }) : []);
    color_threshold:
      - value: -2
        color: 2E7D32
      - value: 0
        color: 388E3C
      - value: 0.25
        color: 4CAF50
      - value: 0.5
        color: 8BC34A
      - value: 1
        color: CDDC39
      - value: 1.5
        color: FFC107
      - value: 2
        color: FF9800
      - value: 2.5
        color: FF5722
      - value: 3
        color: F44336
      - value: 4
        color: C62828
yaxis:
  - id: "1"
    align_to: 0.1
    min: -0.2
    decimals: 2
    apex_config:
      title:
        text: SEK/kWh
      tickAmount: 4
apex_config:
  xaxis:
    type: datetime
    tooltip:
      enabled: false
  tooltip:
    enabled: true
    x:
      show: true
    fixed:
      enabled: true
      position: topLeft
  chart:
    height: 240px
  grid:
    show: true
    borderColor: rgba(255,255,255,0.1)
    padding:
      top: -20
      bottom: -15
What has changed is the Javascript code under the data_generator key:
      return entity.attributes.raw_today.map((data) => {
        return [data["start"], data["value"]];
      }).concat(entity.attributes.tomorrow_valid ?
      entity.attributes.raw_tomorrow.map((data) => {
        return [data["start"], data["value"]];
      }) : []);
It first maps the x-value and the y-value as an array with two items for today’s values, which we assume always is present. Then we concatenate tomorrows values if the attribute tomorrow_valid is true, else we concatenate nothing.